I was recently trying out the cross-browser testing capabilities of LambdaTest, which provides automated testing in all major browsers on a scalable, online cloud-based Selenium grid. The LambdaTest platform frees you from the headaches of manually administering an in-house Selenium grid and therefore having to keep multiple devices connected, updated and running on-demand. With one simple subscription, you get access to live interactive testing to support your exploratory testing, as well as reliable and repeatable automated Appium and Selenium testing capability. Being a cloud based service brings other benefits, such as being able to parallelise automated tests and thereby shorten test cycles, as well as performing localization testing of your app by executing your tests from multiple global locations across more than 27 countries.
For automation testing, LambdaTest supports Java, JavaScript, Python, Ruby and PHP, but coming from a C# background I wanted to augment the example documentation provided by LambdaTest on getting started executing C# tests with Selenium. So I have put together an example solution and made this available on GitHub. You can clone this project or browse the GitHub code to see how it’s done.
I still think it’s pretty incredible being able to log in to a cloud platform like LambdaTest and be able to watch videos of your UI tests being fired up and verified in multiple browsers. To see the example code in action, you’ll need to:
- Sign up for a free LambdaTest account and log in.
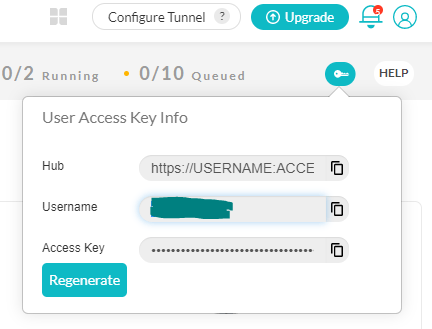
- You will need your LambdaTest credentials – username and accessKey – to see your tests’ execution. So on your LambdaTest dashboard, click on ‘Automation’ in the left navigation bar. In the top-right corner click on the key icon to retrieve your credentials, as shown in Figure 1 below.
- Get a copy of the example code from the GitHub repo, and replace the remoteUserName and remoteAccessKey within the TestConfiguration class with the above fetched credentials.
- Ensure that the isRemoteTestingSession boolean within the TestConfiguration class is set to true. Otherwise, your tests will start spawning local browser instances.
- You should then be able to compile the code and run the tests in the ToDoAppTests class.
You can also get your username and accessKey from your profile section.
The rest of the article demonstrates the example given in the LambdaTest documentation using my Github project. Like the original documentation, this project also uses the sample To-Do List app available on the LambdaTest GitHub account as the application under test.
xUnit as the unit test framework
The first thing I did is to create a new xUnit test project in .NET Core 3.1, and brought the LambdaTest C# example into a test method within this project. Rather than using NUnit, I adapted the code to use xUnit. They’re both great unit test frameworks but I wanted to show how it could be done in an alternative framework for comparison. The test class itself is called ToDoAppTests.cs and it contains a few test methods. The first, VerifyPageTitle, is the most simple, as it just checks the page title is as expected:
[Theory]
[Trait("Category","SmokeTests")]
[MemberData(nameof(GetTestData))]
public void VerifyPageTitle(TestBrowser browser)
{
    var testConfiguration = new TestConfiguration(browser);
    var driver = testConfiguration.GetDriver();

    var page = new ToDoAppPage(driver);
    driver.Manage().Window.Maximize();
    page.GoToPage();
    Assert.Equal("Sample page - lambdatest.com", page.PageTitle);
    driver.Quit();
}
There is also a test called AddAndVerifyToDoItem which interacts further with the app. Using the xUnit MemberData class allows each test method to be executed multiple times – once for each target browser – by passing an enum representing the browser into the test method.
public static IEnumerable<object[]> GetTestData()
{
    return new List<object[]>
    {
        new object[]{TestBrowser.Chrome},
        new object[]{TestBrowser.InternetExplorer}
    };
}
Implement Page Object Model (POM)
Whilst this could be considered overengineering for a simple getting started example, the Page Object Model design pattern is none the less a good practice when it comes to UI test automation. I created a very simple ToDoAppPage class within my test project and gave this class the responsibility of page-level UI interactions. This way, you don’t end up with selectors and other page-specific nastiness interrupting the readability of your tests.
The methods of the ToDoAppTests class creates instances of this ToDoAppPage class as required in order to carry out interactions with the UI.
DesiredCapabilities and browser specific options
In order to control the remote Selenium driver in your code you have two options.
Firstly, DesiredCapabilities is a Selenium class which encapsulates a series of key/value pairs representing aspects of browser behaviour. In the case of the LambdaTest platform this gives you access to a number of specific platform capabilities, for example:
- Lambda Tunnel – connects your local system with LambdaTest servers via SSH based integration tunnel, enabling testing of locally-hosted pages and applications
- Network throttling – reduces network bandwidth to simulate how your application responds when accessed over low-latency networks
- Geolocation – Check if your users get to see your website as intended when accessed from different Geolocations
- Headless browser testing for running tests without a UI
- Screenshot and video capture during test execution, for reviewing within the LambdaTest dashboard
- Network – Not to be confused with network throttling mentioned above, the network capability generates network logs for low-level diagnostics of network interactions
- TimeZone – Configure tests to run on a custom time zone
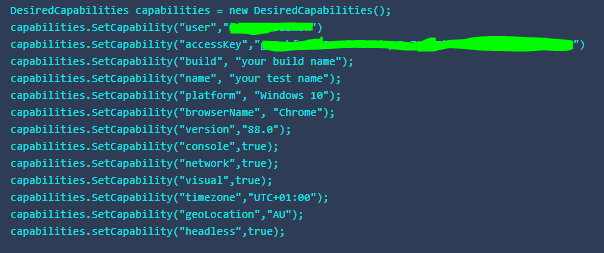
LambdaTest provide an intuitive capabilities generator, an online tool which interactively generates DesiredCapabilities code in your choice of 6 languages based on your selections in the UI. The screenshot below shows an example of C# code generated with many of the capabilities enabled.
Over time, the Selenium project has indicated an eventual move away from DesiredCapabilities, as the use of DesiredCapabilities was deprecated from version 3.14 of the C# Selenium bindings, and instead the alternative approach is to use browser-specific options classes. Within the TestConfiguration class of my project, I have shown how this could be done by implementing a number of private methods to set up the appropriate driver options depending on which browser is being used. As mentioned earlier, the target browser is determined at the point the class is instantiated within a test method, by passing the appropriate browser enum into the constructor, thereby allowing each test to be executed against specific browsers as required.
Switch between remote and local drivers
If you hit a bug while running in LambdaTest cloud, the last thing you want to be doing is re-writing your code to replace the RemoteWebDriver class with a local ChromeDriver or other specific browser class in order to step through and debug while running locally.
The TestConfiguration class also includes the boolean value isRemoteTestingSession to indicate whether the tests should be run using local browsers or the remote driver. Depending on how you’re running your tests, you may want to set this using a configuration file or pass it in as a command-line parameter to your tests, for example from your CI/CD server. LambdaTest has a series of helpful articles that show how to integrate LambdaTest into your CI/CD platform of choice. If you’re just trying out the example project you’ll need to simply toggle the remote testing flag in code.
LambdaTest Dashboard
Once you’ve executed the tests against LambdaTest you can log in to the dashboard and review the results of your tests. The UI of the testing dashboard is another area where LambdaTest really shines and makes it straightforward to pinpoint and correct issues in your tests.
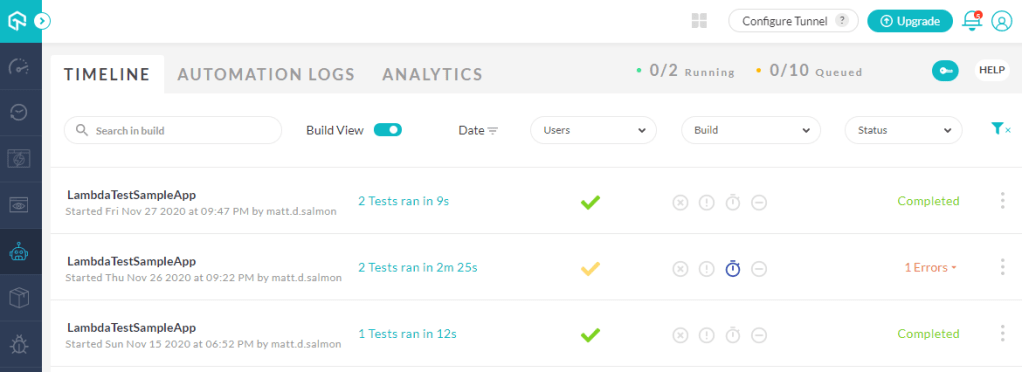
Within the ‘Automate’ section, there are 3 main navigation areas. Firstly, the timeline view shows a list of test execution sessions. Note that there are filters across the top of this list to filter the results by date, user, build and status to more quickly refine the tests you want to review. You can also programmatically specify custom tags to group your Selenium tests:
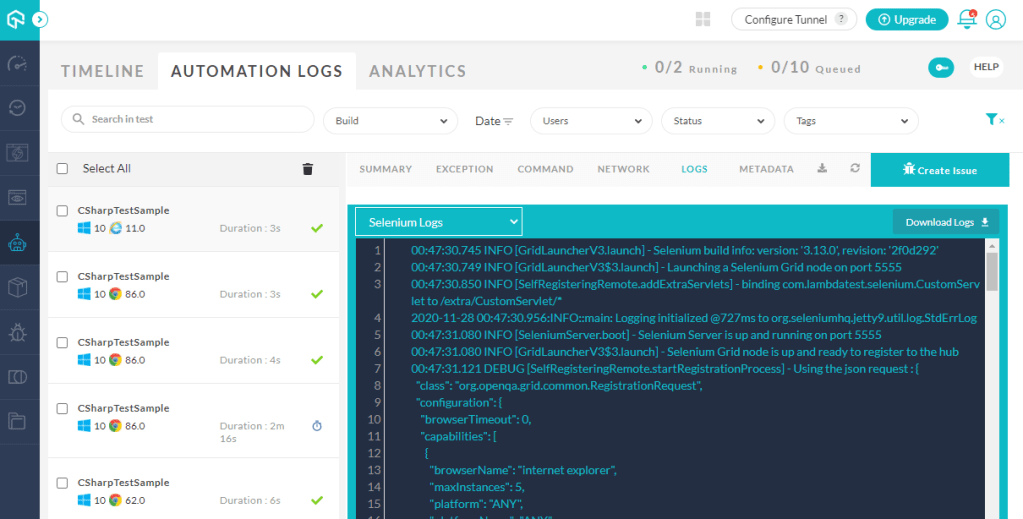
The results are grouped by build as standard, and clicking into each of these takes you across to the second navigation area, automation logs, which provides further detailed analysis of each test outcomes, including the ability to watch recordings of the tests, review network requests/responses and view test logs, if you’ve specified these capabilities in your test options. Note also that the ‘Create Issue’ button provides one-click bug logging via integration with JIRA, GitHub, Trello and other popular tracking platforms:
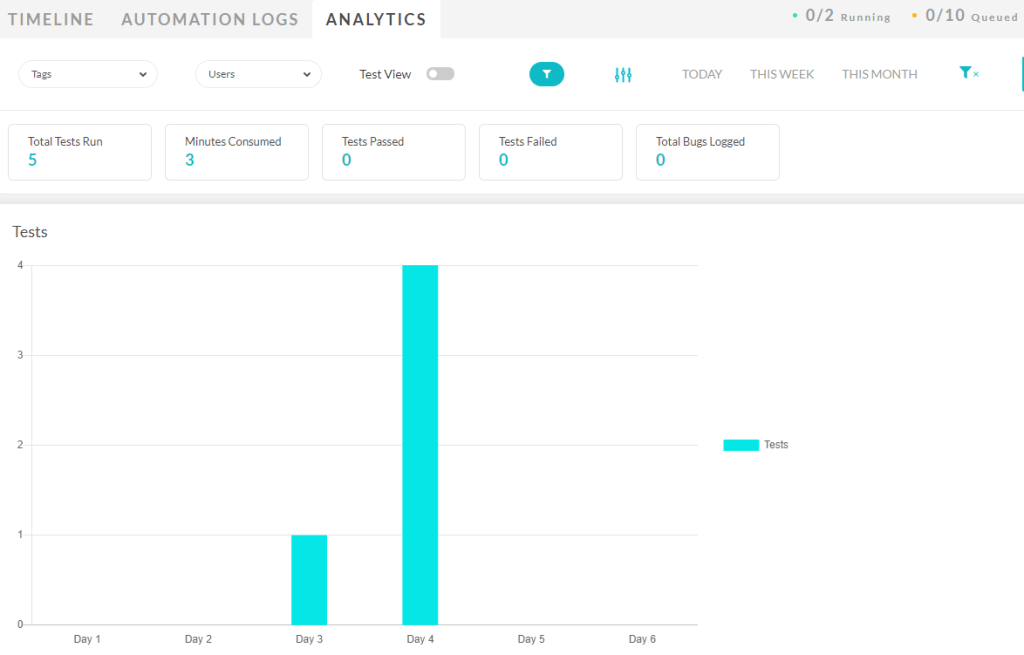
Finally the Analytics option provides metrics on your test execution and can be customised to include specific graphs and filters to specific time periods you’re interested in: